Increase Ad Revenues with Data Visualization—What Media Publishers Must Know
Digital transformation is the reason why content management systems like Drupal have become essential in the media industry¹. Media outlets and publishers must adopt new tools to overcome the challenges of today’s market. There exists a myriad of challenges such as :
- Loss of revenue by traditional formats
- Diversification
- Adapting to new devices
For media outlets, digital transformation can make a huge difference in maintaining your current advertisers and captivating new ones: Advertisers will know that your organization is up to date with industry trends and standards.
Aside from helping polish your content, part of going through digital transformation is knowing how to sell your product.
Direct ad sales are more customized, profitable, and lasting yet harder to close than other types of ads revenue. Knowing how to convince advertisers helps ensure lasting relationships, for which there are different digital services available.
Here in this article, we will review one such service: 'data visualization'.
A Bain & Company study² has shown that
Data visualization makes decision-makers five times faster than market peers and three times more likely to execute decisions as intended.
Now, we will see:
- What data visualization is?
- How does it work?
- How it can help your business?
- Which are the digital tools for implementing it?
Captivating Advertisers: What Is Data Visualization?
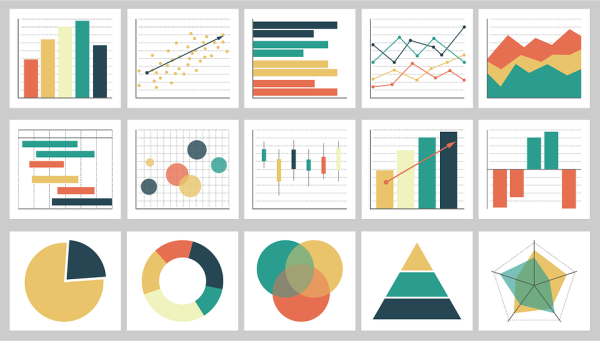
Data visualization is the visual representation of all kinds of data, such as brand info and revenue, customer’s behaviour and trends, patterns, and outliers. Data visualization can take the form of charts, graphs, maps, tables, and figures to communicate data.
Data visualization works to make sense of large amounts of data and helps convey how it comes together to viewers. More importantly, data visualization is fundamental for decision-making.
The Three Ways in Which Data Visualization Helps Increase Revenue
First of all, let’s acknowledge that investors make decisions based on:
- Profit:
What’s in for them after investing in your platform? They want to know how advertising in your media can translate into customers and profit. - Social proof:
References and results with other clients and your brand’s status. According to PhD scholar and digital platforms expert Sofia Bapna, “social proof is a sign of quality,” in making investment decisions3. - Professionalism:
How dealers communicate and present themselves.
Investors can only judge if an investment checks these boxes after reviewing the data that is available to them.
Decision-making is now data-driven. Data visualization as a tool helps you to present your product to advertisers. It will also help you convey these factors:
- Show advertisers how much they will make from your platform and how
- How much have you done for other advertisers in the past
- Prove your expertise as a reliable source of information and knowledge in the industry
Digital Tools for Data Visualization: Where Should I Start?

Before going any further and jumping into the many digital tools available, you want to have a clear notion of the data visualization you need. To do so, start by determining the right data and visualization system, both of which will depend on what you want to convey.
Collecting Data
The starting point is collecting data. Customer Data Platforms are great tools for this task4.
Data will help you use visualization systems to show metrics and other information to help advertisers understand what they have achieved or could achieve by establishing a partnership with you. The data you want to collect is:
- Traffic to your site
- Top traffic sources
- Interactions per visit
- Time on page
- Page load speeds
- ROI
- Revenue
- Bounce rate
Perhaps the most important metric is the volume of visits your site receives, especially if your site attracts the specific crowd your advertisers try to reach. Advertisers will also be interested in information on the segments of people that visit your site. Showing age, gender, or income levels will help them make decisions.
Google Analytics5 is an excellent tool for collecting these metrics, including page views, and can also help get more page views.6
Presenting data
Getting the data is just halfway there. It follows making sure of presenting it the right way.
To address advertisers, you want data visualization that is:
- Clean: Visual design should observe colour and format choices for making reading information as comfortable as possible.
- Clear: Information should be easy to read and understand.
- Precise: Visualization shouldn’t be comprehensive but limited to what is essential in a particular case.
- Concise: Yet, you shouldn’t leave what’s important out of the equation.
- Reliable: Reliable and—when possible—openly available information will help clients trust your visuals and you.
Choosing the Right Visualization
Visualizations can be conceptual (focused on teaching ideas), data-driven (focused on showing results through statistics), or a combination of both.
The best choice for decision-makers such as advertisers is to use data-driven visualizations to make statements of the quality or certainty of what you offer. Suppose advertisers are looking to know something more specific—for instance, ‘how your media team has performed in the last trimester,’—you can use visual data to explain whether your content is at fault for negative indicators or whether it’s due to external causes.
Conceptual visualizations, for their part, can work in the case you want to layout the structure of complex systems. Let’s say you want to present your whole organization composition or publishing workflow to potential advertisers. Visuals will help provide a quick and easy glance of these things, plus how careful you’re with your product or service.
The Bottom Line
You may be tempted to think that data visualization belongs to presentations, meetings, and the like. Yet, you can adopt data visualization as part of your site. As an example, media kits are documents on your site meant for advertisers. Media kits briefly outline your brand and what you do, your site statistics, ads rates, discounts, special offers, and contact info.
Experts can help you determine how to use data visualization for your benefit. A cross functional expertise in data collection, data analysis, and UI/UX, is what you should expect from the ideal service provider.
References:
- Nisha Oommen, Zyxware (online), “Global media and entertainment industry: Trends, challenges and a future with Drupal” Dateline November 06, 2016. Link accessed on 2021-11-30
- Travis Pearson and Rasmus Wegener, Bain and Company (0nline), “Big Data : The Organizational Challenge”, Dateline September 11, 2013. Link accessed on 2021-11-30.
- Sofia Bapna, InformsPubsOnLine (online, pdf), The Institute for Operations Research and the Management Sciences Journal. Management Science: Volume 65, Issue No. 2, “Complementarity of Signals in Early-Stage Equity Investment Decisions: Evidence from a Randomized Field Experiment” Published Online: September 25, 2017. Link accessed on 2021-11-30. https://doi.org/10.1287/mnsc.2017.2833
- Safia F. Mohiuddin, Zyxware (online), “Customer Data Platforms for Unified Customer View in Critical Decision-Making”, Dateline April 18, 2017. Link accessed on 2021-11-30.
- Moses Raymond, Zyxware (online), “What is Google Analytics and what are its business benefits?” Dateline September 10, 2015. Link accessed 2021-11-30.
- PremShankar P. B., Zyxware (online), “How to Get Page Views of a Site using Google Analytics Data?” Dateline November 24, 2017. Link accessed 2021-11-30