Website Personalization: Leveraging Content Groups for Personalized Digital Experience
Introduction
Website personalization has become an essential aspect of online marketing in recent years. With the help of personalization, businesses can provide a better user experience to their customers and increase engagement and conversions.
One of the critical components of website personalization is determining the user's interests. If we know what the user is more interested in, we can use that information to show messages relevant to the user and get a better chance of conversion on the website.
Website Personalization Demo
Before Personalization
Here, the Drupal-related message on the right sidebar is available only on a Drupal-related page. When the user moves to a different page, a MarTech-related message appears.
After Personalization
Once the personalization gets triggered, the message follows the user regardless of the page they visit. With content group-based personalization, it is now possible to show messages based on the group of content the user most accesses. Read on to understand the details. Please let us know if you are interested in a conversation about website personalization.
Content Groups to Determine Users' Interest
We are experimenting with the website personalization engine we developed to improve the conversion rate on our website. One feature we have added to the system recently is its ability to identify users' interest in our services.
In the early stages of our personalization engine, we directly used the taxonomy of the content user visits and showed them the message relevant to the page they are visiting. This kind of messaging is not personalization but offers dynamic content depending on the current page the user visits.
New Feature on the Website Personalization Engine
As we improved our targeting mechanism, we can now personalize content based on the user's overall interaction on the website.
The popular solution for personalizing the user journey is using a customer data portal like Unomi and its built-in persona detection system. Yes, that will work, but we need to implement a simple approach to experiment with this before we go for a complex system. Also, for machine learning systems to work efficiently, there should be good enough data to process. For a typical B2B scenario like ours, a simple solution based on content grouping will work.
Content groups are classifications of content that are related to each other. In our case, we use taxonomies like Topic Cluster, Marketing Campaign, Target Audience etc., to group content. These groups are tied to our services around Drupal, Marketing Technology Fractional CTO etc. (If you want to know more about how we classify content in bulk, please read the blog.)
If we write about Drupal or any related topic on our website, the connected service would be our Drupal Services.
Implementation of the User Interest Detection System
We use first-party cookies and local storage to collect data in the user browser for the prototype. Customer data portals like Unomi can be connected with our engine to store the aggregated data centrally, gather insights and further optimize this. We use Google Analytics to capture the user journey and do the analysis.
Sample Data
contentGroups.interests = [
  {name: 'Drupal', visits: 5},
  {name: 'MarTech', visits: 4},
  {name: 'FractionalCTO', visits: 1}
];
contentGroups.totalVisits = 10;
Challenges
Once we have tracked the user's visits to each content group, we need to determine their interest in each group. One way to do this is to calculate the percentage of visits to each group out of the total visits. This method has a few limitations.
- It does not take into account the fact that some content groups may be more popular than others.
- Second, it does not give us a clear picture of the user's actual level of interest in each group.
We use logarithmic scaling to normalize the data we tracked for the calculation to overcome these limitations.
Logarithm to Normalize Data
The logarithmic function has a unique property that makes it ideal for our use case - as the number being evaluated grows, the increase in value becomes smaller.
To illustrate this, take www.zyxware.com with content groups: Drupal, MarTech and FractionalCTO. We want to track which groups a user is most interested in based on the times they visit each group. Let's say the user has visited the website ten times, and their visit history for each group is as follows:
Drupal:        5
MarTech:       4
FractionalCTO: 1
Using a simple count-based system, we could calculate the user's interest level for each group as follows:
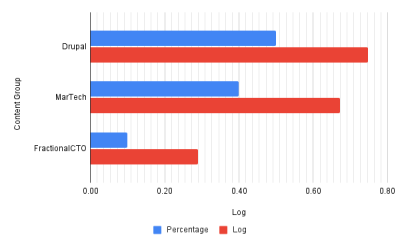
Drupal:        5/10 = 0.50
MarTech:       4/10 = 0.40
FractionalCTO: 1/10 = 0.10
Based on these numbers, the user is most interested in Drupal. But the difference between 5 visits and 4 visits matters little. But if we try to set the threshold as 0.5, we will get [Drupal] as the only group user is interested.
Now let's consider using the logarithmic approach. We can calculate the interest level for each group as follows:
Drupal:        log(5+1) / log(10+1) = 0.75
MarTech:       log(4+1) / log(10+1) = 0.67
FractionalCTO: log(1+1) / log(10+1) = 0.29
In this case, the logarithmic approach yields more accurate results. The differences in the interest levels between each group are smaller, which more accurately reflects the user's level of interest. If we try to set the threshold as 0.5, we will get [Drupal, MarTech] as the group user is interested, and we can show messages related to both services to this user.
Calculate the Interest Level
We iterate over the content group and do the math to calculate the user's interest level for each content group.
contentGroups.interests.forEach(group => {
  group.interest = Math.log(group.visits + 1) / Math.log(contentGroups.totalVisits + 1);
});
Let's say we want to determine the user's interested groups with a confidence threshold of 50%.
//The parameter determines the desired confidence level in the selection process.
const confidenceThreshold = 0.5;
Next, we iterate over each content group again and check if their interest value is greater than or equal to the confidenceThreshold. If it is, we will add the group to our list of interested groups.
Here is the function to pick the user's interest based on the visits to the specific group of content.
function selectInterestGroups(contentGroups, confidenceThreshold, includeHighest = false) {

  const groups = contentGroups.interests;
  const totalVisits = Math.log(contentGroups.totalVisits + 1);
  const selectedGroups = [];
  let highestInterest = 0;

  for (let i = 0; i < groups.length; i++) {
    const group = groups[i];
    const interest = Math.log(group.visits + 1) / totalVisits;
    group.interest = interest; // add interest property to the group

    if (interest >= confidenceThreshold) {
      selectedGroups.push(group.name);
    }

    if (interest > highestInterest) {
      highestInterest = interest;
    }
  }

  if (selectedGroups.length === 0 && includeHighest) {
    for (let i = 0; i < groups.length; i++) {
      if (groups[i].interest === highestInterest) {
        selectedGroups.push(groups[i].name);
      }
    }
  }

  return selectedGroups;
}
If we execute this with our sample data,
const contentGroups.interests = [
  { name: 'Drupal', visits: 5},
  { name: 'MarTech', visits: 4 },
  { name: 'FractionalCTO', visits: 1 }
];

contentGroups.totalVisits = 10;
console.log(selectInterestGroups(contentGroups, 0.5))
The result will be
[Drupal, MarTech]Conclusion
Personalizing content for website visitors can significantly improve user engagement and satisfaction. The model we currently use on our website allows us to do digital marketing experiments to test our hypothesis on content classification, User interests etc. More than anything else, it gives us insights into what our visitors look for on our website.
Let us know if you want to try this system on your Drupal or WordPress websites.