Improving Transparency Of Government Departments Using Interactive Dashboards
Introduction
The client, one of the early adopters of e-governance, had implemented a real-time dashboard for monitoring the progress of the various projects executed across their council. The objective of the dashboard was to improve the transparency of the council and give complete visibility to its citizens into the projects. This project was first implemented in 2018 and has been getting plaudits from across the board. Many a city council has since adopted such dashboards to improve their transparency in capital works projects. As part of the website upgrade project, the city council has decided to improve the citizen experience on the project's dashboard and make it more interactive for the users.
Challenges
The transparency platform is being implemented as an interactive map that offers users the ability to filter using ProjectName, Budget, Location, and the stages of the project namely Plan, Design, Procure, Build and Finish. A list view also will be created for the users who would prefer that interface.
The users will also be able to search for the project on the map. Search output will be presented as a project list, as well as on the map. A reverse filter option is also made available in the map where a user can select a particular area on the map and it will zoom that area and filter results from that area only.
Solution
Considering the availability of various contributed modules which support the features required to build the solution and aligning to the vision of the City Council to reduce the total cost of ownership of the platform, Drupal 9 was chosen. Drupal, one of the most secure open-source web software, allows the management of content easier for editors and content authors.
With the ease of use in focus for users and additional customization features from UI, our platform solutions design team decided to use the Views module along with the views database connector contributed module to get record information from an external database.
Having that related information collected via Views another contributed module Leaflet was used to showcase listed data in maps. However, the Leaflet module does not support custom fields, our team decided to reuse the existing leaflet module and create a new Leaflet View plugin for rendering data from external custom fields data sets.
Result
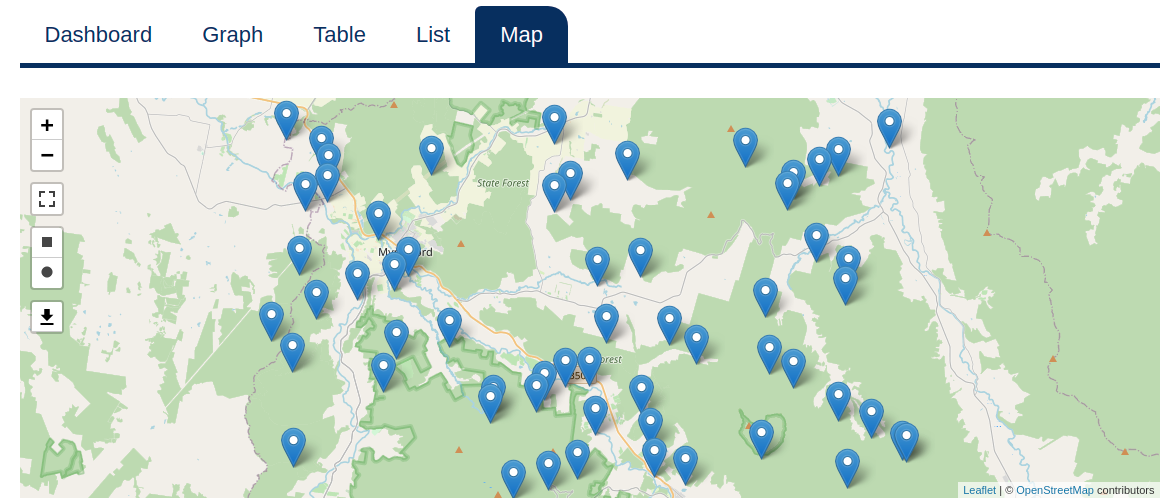
Users can view data rendered on a map from an external data source which is queried using core views.
For achieving the filter capability in the map, leaflet draw javascript capability was used and an additional views filter plugin was defined. Whenever an area is selected based on the bound region on the map a set of data is captured using leaflet draw and is passed to the views filter for rendering only selected data.
For printing the map, an external leaflet easy print library was incorporated into the map via a custom javascript file.