What is Cause effect graphing?
Cause effect graphing is a mapping technique, which is used to analyse combination of input conditions and effects may be through of as the output. The Cause-Effect Graphing technique derives the least number of test cases to cover 100% of the functional requirements to improve
the quality of test coverage.The cause-effect graphing technique uses the same algorithms that are used in hardware logic circuit testing. It has the ability to detect defects that cancel each other out, and the ability to detect defects hidden by other things going right. It is a graphical representation of inputs (causes) with their associated outputs (effects), which can be used to design test cases.
Advantages:
- They are easy to understand and intuitive to use.
- Transform each column into test case.
- Systematic method for generating test cases representing combinations of conditions.
- Visual clues for missing or incorrect relationships.
Example:
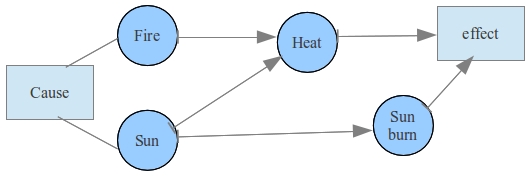
“Sun” is a cause for “heat”.
“Fire” is a cause for “heat”.
“Sun” is a cause for “sunburn”.
So, there are 3 cause-effect relations in this example:
(Sun->heat)
(Fire->heat)
(Sun->sunburn)
 This is a testing method which is suitable for Drupal programmers as well as testers.It play an very importent role in the field of software testing.